Atlas Map Viewer
The Atlas Map Viewer is an interactive geospatial mapping tool that allows users to adjust spatial layers associated with five key areas of importance to sustainable water resource management in the context of climate change: Environment, Soco-economic, Hazards and Climate Change, and Basin Diagnostic Analysis.
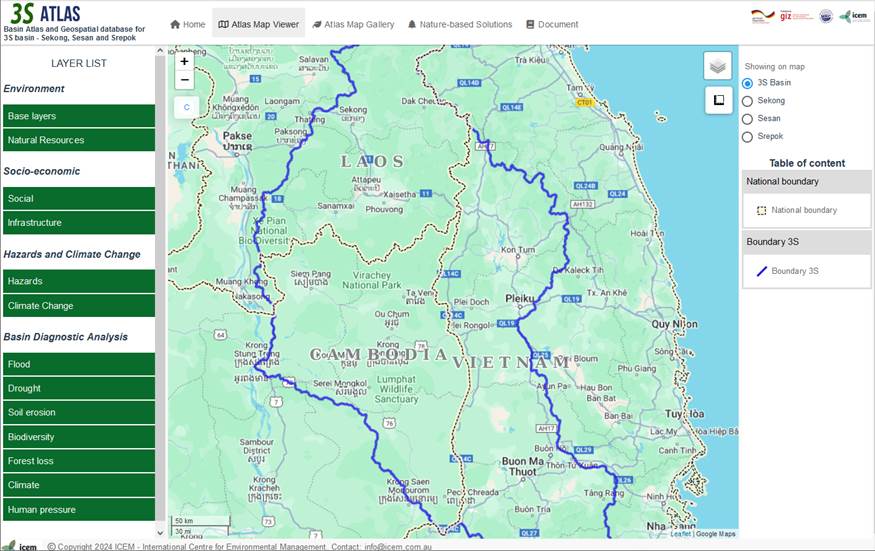
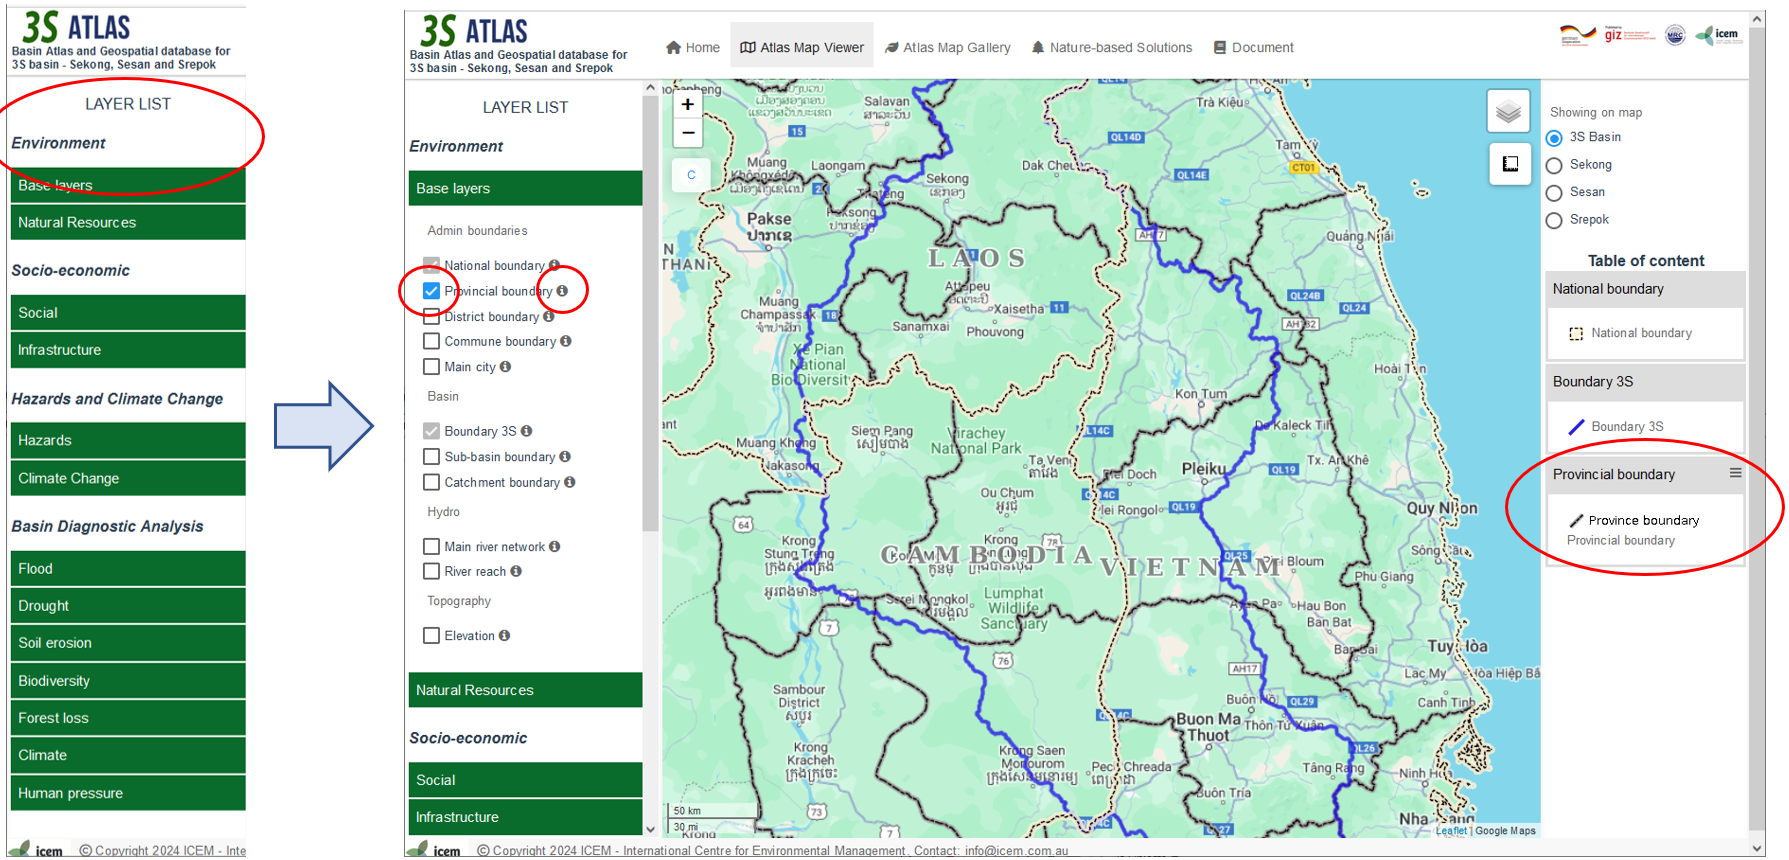
The Atlas Map Viewer provides interactive functionality where spatial data layers can be comprehensively presented and explored. The main components of the viewer, as shown in Figure 2, include:
- Layer List on the right of the page, listing the data layers ingested into the atlas;
- Map Frame in the middle of the page, for displaying spatial layers;
- Basin zoom tool on the top right of the page, for Zooming and shadowing focus basin; and
- Table of content area under the Basin zoom tool.
The Atlas Map Viewer
Layer List functionality
On the Layer List, data layers are divided into four groups: Environment, Socio-economics, Hazard and Climate Change, and Basin Diagnostic Analysis. Each group is further divided into sub-groups consisting of data layers representing similar themes. A list of datasets incorporated into the atlas is attached at the end of this manual for download. Users are able to
- Expand or collapse the layer list in each sub-group by clicking on a sub-group name (sub-group name will turn to green when users move the mouse in);
- Add or Remove a layer on the map frame by check on the box on the left of the layer name. After a layer added on the Map Viewer, it’s shown on Table of content with layer name and symbol used.
Layer list funtionality
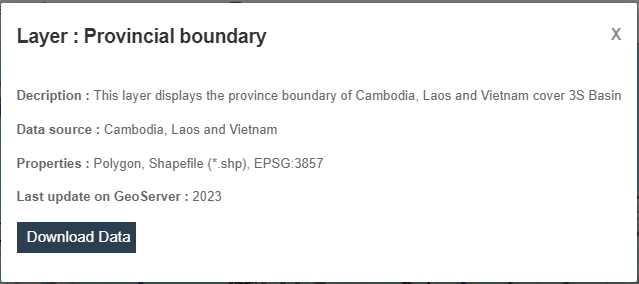
- View layer description and download spatial data by clicking on the Info button on the right of a layer name. A pop-up window will appear to display the metadata of the dataset. Metadata information includes layer title, description, data source, data type, coordinate reference system (CRS), and date of the last update. Users can also click on the Download button to download spatial data (in Shapefile or GeoTiff formats) for further analysis and working offline on GIS software.
View layer description and download spatial data
Displaying spatial layers
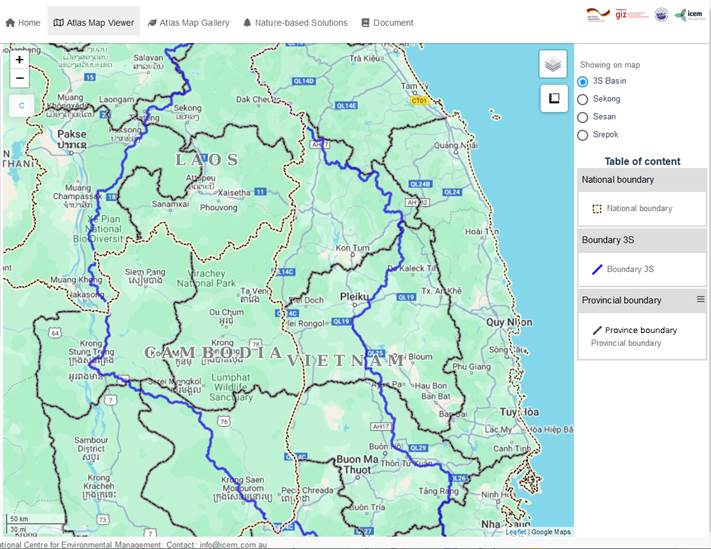
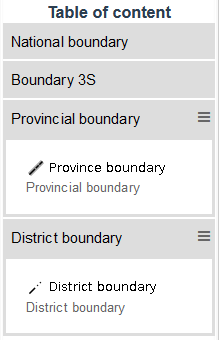
When a layer is active on the Layer List, it will be displayed on the Table of Contents (ToC), with the layer name and corresponding symbol displayed as an image on the map frame. The layer legend will be displayed on the legend area (to the right of the map frame – Figure 5). When first visiting the Atlas Map Viewer, the map will automatically display a number of integral layers – the 3S sub-basin boundary and the national boundaries of Cambodia, Laos and Vietnam, overlain on a third-party Google Map background basemap. These layers are default and cannot be turned off. Other background basemap layers, including OpenStreetMap, Google Imagery, and Esri World Imagery, can be selected from the Background layer button (at the top right of the map frame). This feature enables the user to change the background map display. Another functionality accessible from the top of the map frame is a measuring tool, that allows the user to calculate distances (in both kilmetres and miles) and areas (in hectares) on the map.
Functionality on Map frame
On the top-left of the map frame, zoom icons can be used for zooming in and out of the map, respectively. Alternatively, users can change the map scale by simply scrolling with the mouse. Bellow the zooming tool is a “C” button to clear all map layers from display (except the integrate national and basin boundaries). The map scale is illustrated by a scale bar displayed on the bottom left of the map frame.
Basin specific zoom function
The Basin specific zoom function is designed to quickly zoom in to one of 3S basins (Sekong, Sesan or Srepok) or of the 3S as a whole. If one of basin selected, the other basins and surroundings will be faded out in grey.
Table of content
The Table of Content shows all layers that have been added/are shown on the Map Viewer. Each layer in the table of content is shown in a collapsible box, with the name of layer in header and setting button. By clicking on the setting button, a layer setting box will be shown to change the layer opacity. This can be done by using the slider
Example of using Table of content
Multiple data layers
Some datasets and layers incorporated into the Atlas comprise multiple data layers or time-series layers (such as the Land cover dataset). On the layer setting box, a slider is available below Layer opacity, that allows users to change the timeline (or other features) of the layer they want to display on the map (e.g., by time or by depth)
Displaying multi-temporal land cover dataset with the time-slider on the map frame

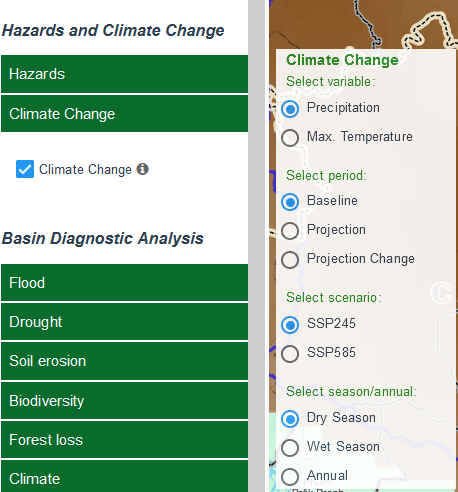
Climate projections
Climate projection datasets include temperature and precipitation. When the Climate Change layer is selected from Layer List, a pop-up will appear on the map frame, which allows users to define targetted data layers to be explored, by selecting deferent parameters, such as climate variables (Precipitation or Maximum Temperature), period, projection scenario, and seasons.
Displaying climate projections
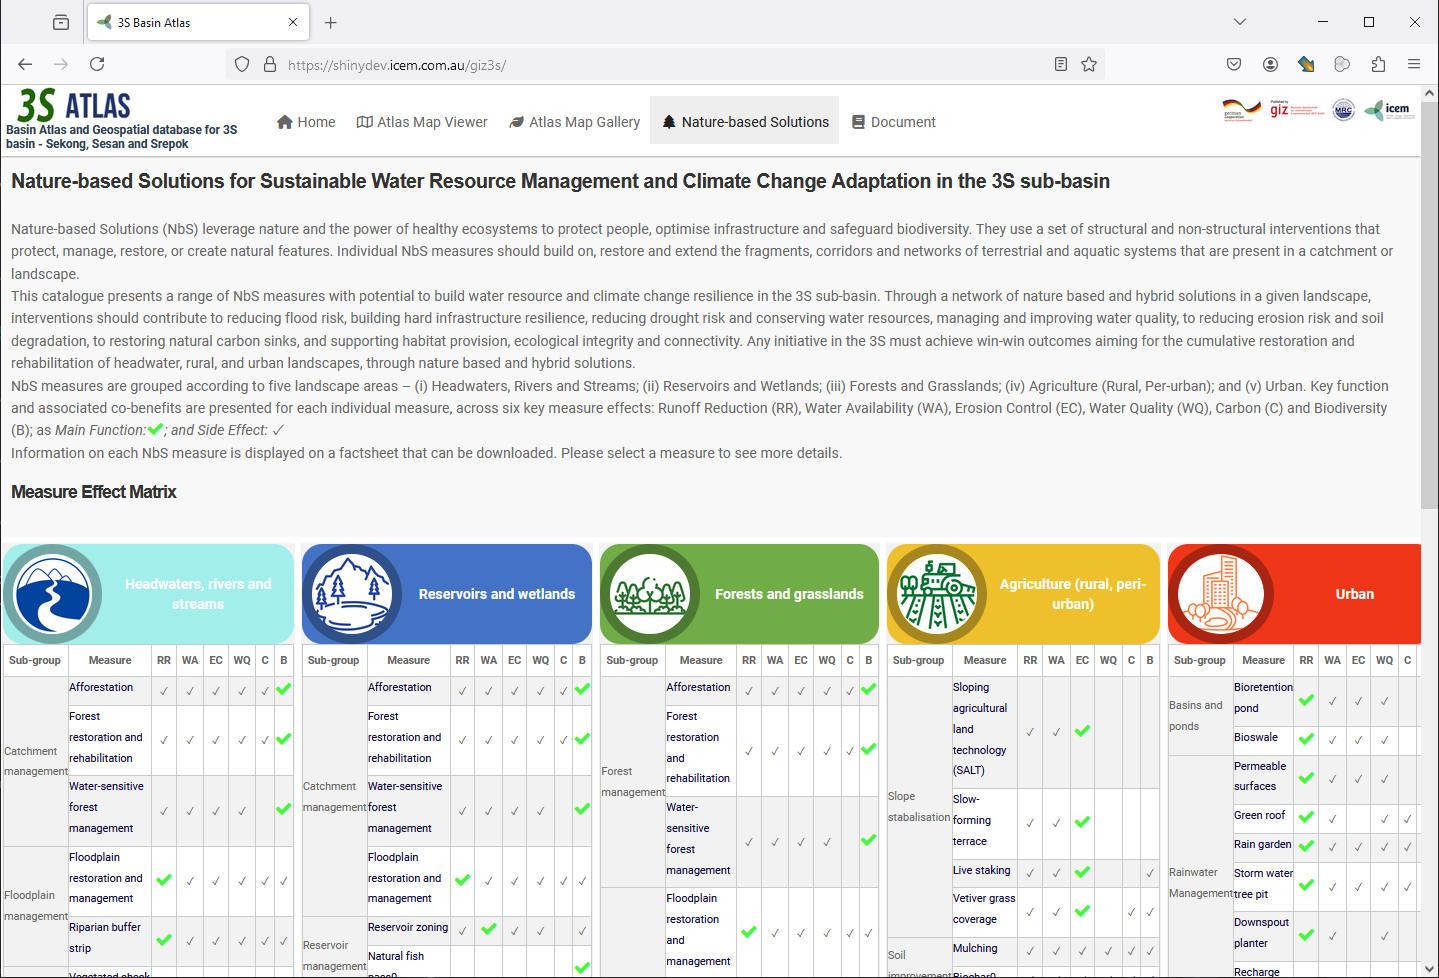
Nature-based Solutions catalogue
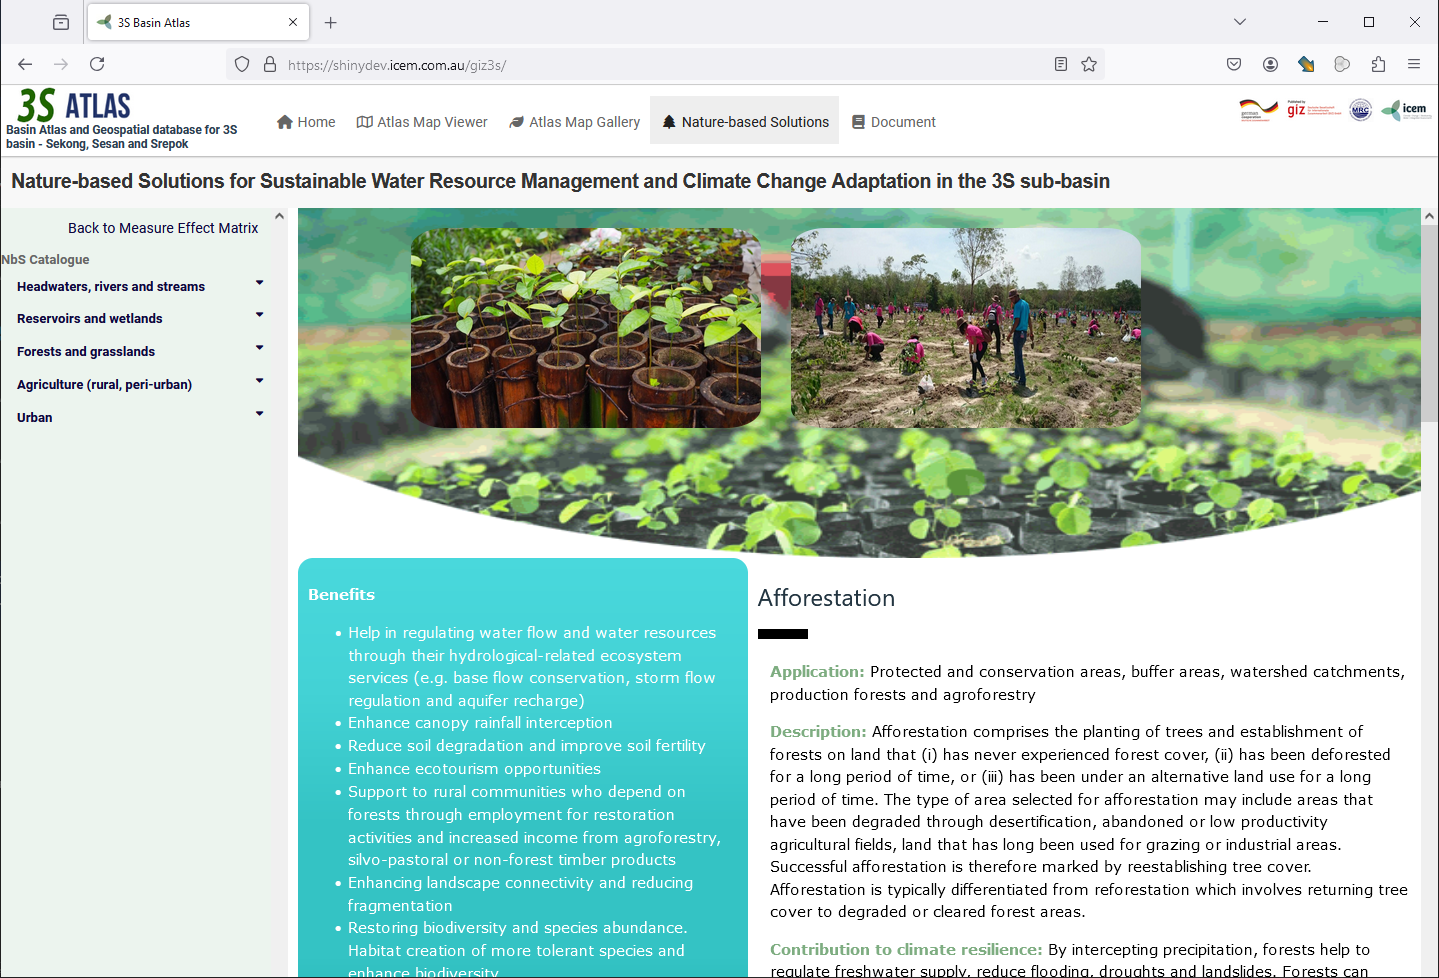
This catalogue presents a range of NbS measures with potential to build Sustainable Water Resource Management and Climate Change Adaptation in the 3S sub-basin. On first visiting the catalogue, an introduction to the NbS Catalogue and the NbS Measure Effect matrix is presented. The NbS Measure Effect matrix groups NbS according to five landscape areas – (i) Headwaters, Rivers and Streams; (ii) Reservoirs and Wetlands; (iii) Forests and Grasslands; (iv) Agriculture (Rural, Per-urban); and (v) Urban. To view an individual NbS measure factsheet, users can click on NbS name on the matrix. Information on each NbS measure is displayed on the factsheet, which can also be downloaded as a PDF for offline saving (Figure 13). To go back the Measure Effeact Matrix, users can click on the button on the top right of the NbS list.
NbS catalogue
 Example of NbS factsheet
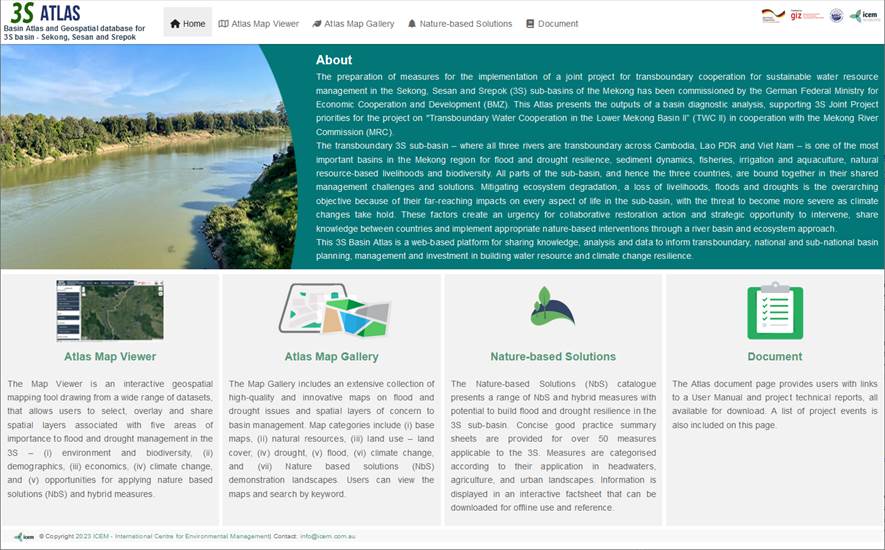
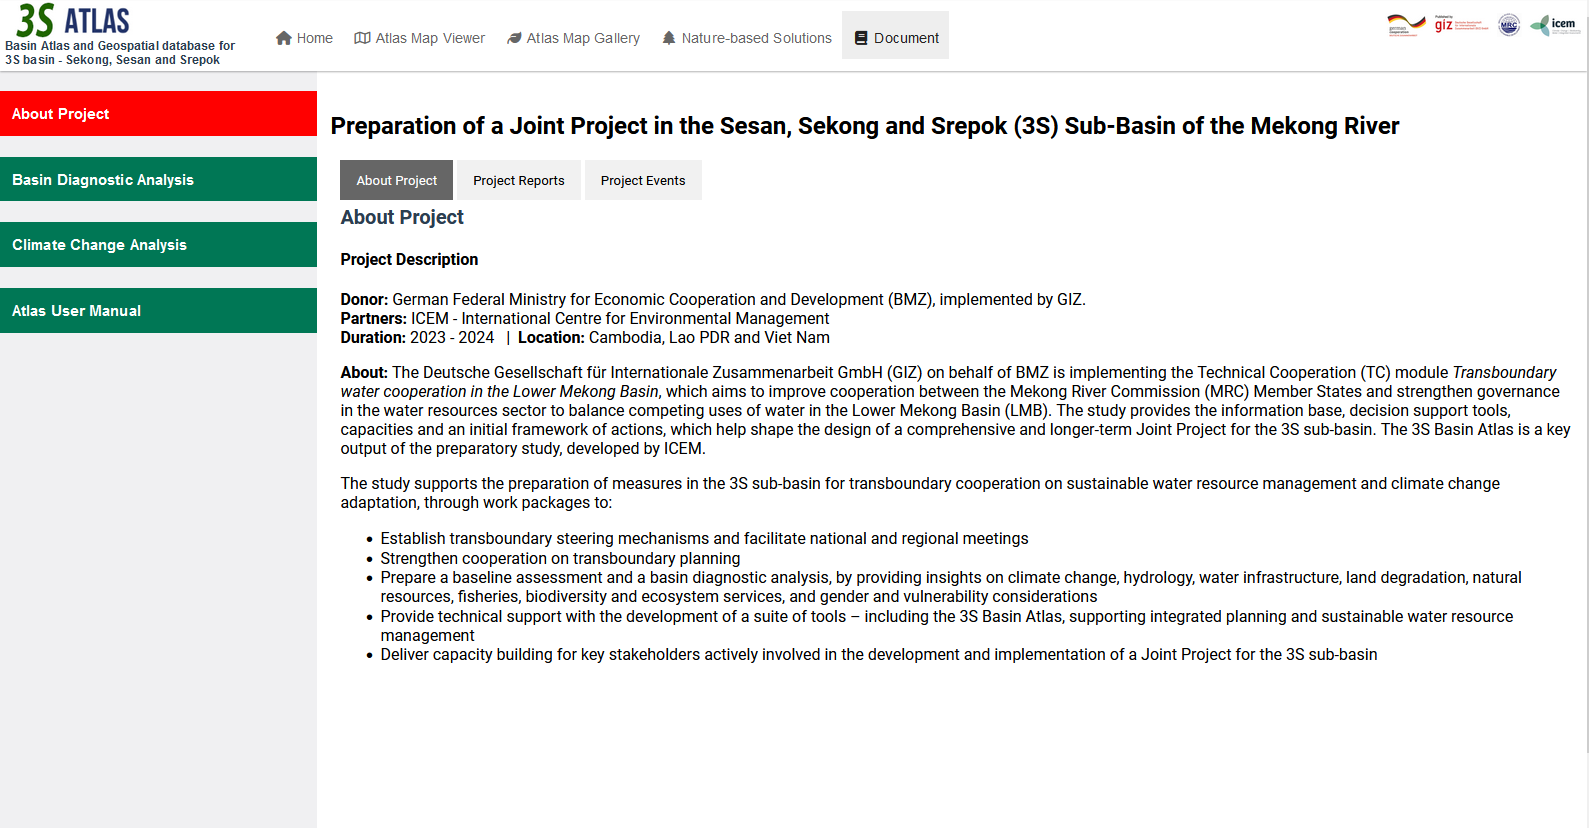
Documents
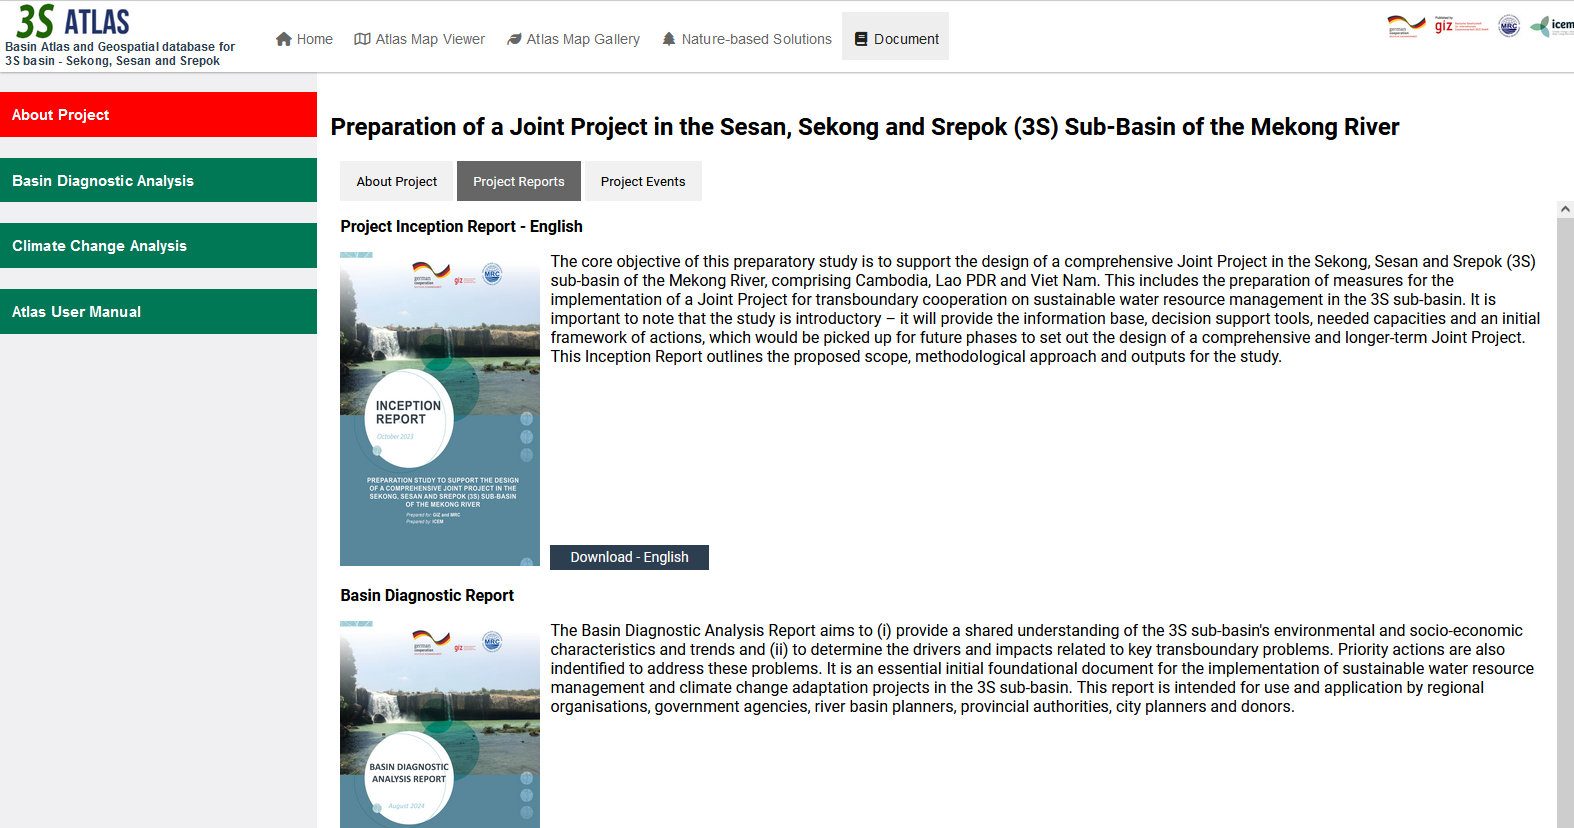
The Atlas document page provides users with a number tabs – About Project, Basin Diagnostic Analysis, Climate Change Analysis, and Atlas User Manual (this document).
In the About Project section, users can download project reports in PDF format by clicking on the download button on the Project Reports tab, or see a summary of all project activities on the Project Events tab.
The Basin Diagnostic page also presents a number of external references for review.
Document page
 Download Report
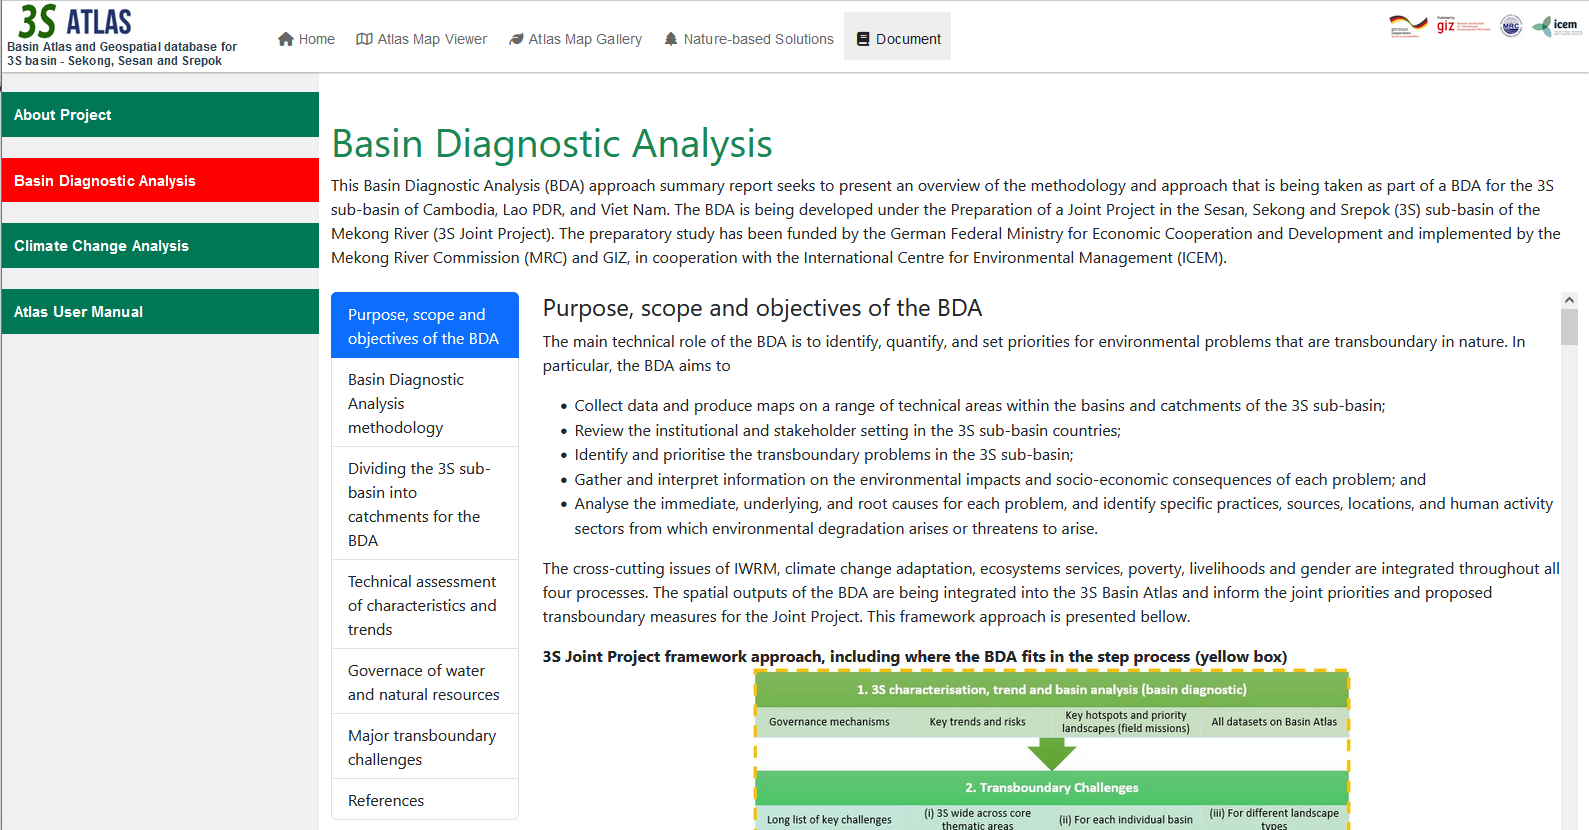
 Basin Diagnostic Analysis